Gold Price History: What Do the Decades Show?
To help you evaluate more realistically why many people see gold as one possible tool for long-term diversification, it is worth looking back at how the price has moved over the past half century. This article is not a buy or sell recommendation; it is historical context to help assess the current market situation. One point up front: past performance is no guarantee of future results.
Before 1971: The Era of the Fixed Gold Price
Under the post-World War II Bretton Woods system, the US dollar was pegged to gold, keeping the gold price artificially stable. That system ended in 1971, the so-called "Nixon shock," when the United States suspended the dollar's convertibility into gold. From then on, the gold price moved freely, based on supply and demand.
The 1970s: A Rapid Rise
After the fixed exchange rate ended, against a backdrop of high inflation and oil crises, the gold price rose to several times its earlier level by the end of the decade. This illustrates how gold can react to a severe, sustained inflationary environment and a loss of confidence in the financial system.
The 1980s and 1990s: A Long, Quiet Correction
After the peak of the early 1980s, the gold price entered a long, multi-decade path that was mostly slowly declining or sideways. This offers an important lesson: gold does not rise in a straight line, and long, low-return periods can occur, during which other assets, equities in particular, can perform considerably better.
The 2000s: A New, Sustained Uptrend Begins
From the early 2000s, the gold price began a renewed, sustained rise, fueled by growing demand from emerging economies, central bank policy, and uncertainty around the 2008 financial crisis. In those crisis years, gold illustrated its classic role: as confidence in equities and banks wavered, demand for the precious metal rose significantly.
The Peak Around 2011 and the Correction That Followed
In the early 2010s, the gold price climbed to a historic high, then went through a significant correction lasting until roughly mid-decade, as conditions stabilized and real interest rates rose. This is a good example of how even a strong long-term trend can involve serious, multi-year pullbacks.
The 2020s: New Momentum
The uncertainty around the coronavirus pandemic, followed by high inflation, heightened geopolitical tensions, and record central bank gold purchases, gave the price renewed momentum, producing new historic highs by mid-decade. We cover this current trend in a separate article; this account describes past events only and is not a forecast of future direction.
What Can You Learn from This Long-Term Picture?
The trend is not a straight line. Multi-decade rising and multi-decade stagnant or declining periods have both occurred, an important reality for anyone planning long term.
The largest swings are often tied to crises. The most significant increases have typically coincided with inflation shocks, financial crises, or geopolitical uncertainty.
Timing is difficult, close to impossible to get exactly right. Even well-performing long-term periods included unfavorable stretches of several years, which is why many buyers prefer gradual, regular purchases over one large, precisely timed purchase.
How Should You Relate This to Your Own Time Horizon?
If you are thinking on a short, few-year horizon, the historical data show that you should be prepared for significant swings in either direction. If you are planning on a decades-long horizon instead, the long-term trend lends more support to a diversification role, provided you can accept intervening periods, sometimes lasting years, of sideways or declining prices. This is not a guarantee of anything; how relevant it is depends entirely on your situation, goals, and risk tolerance.
How to Read a Long-Term Price Chart
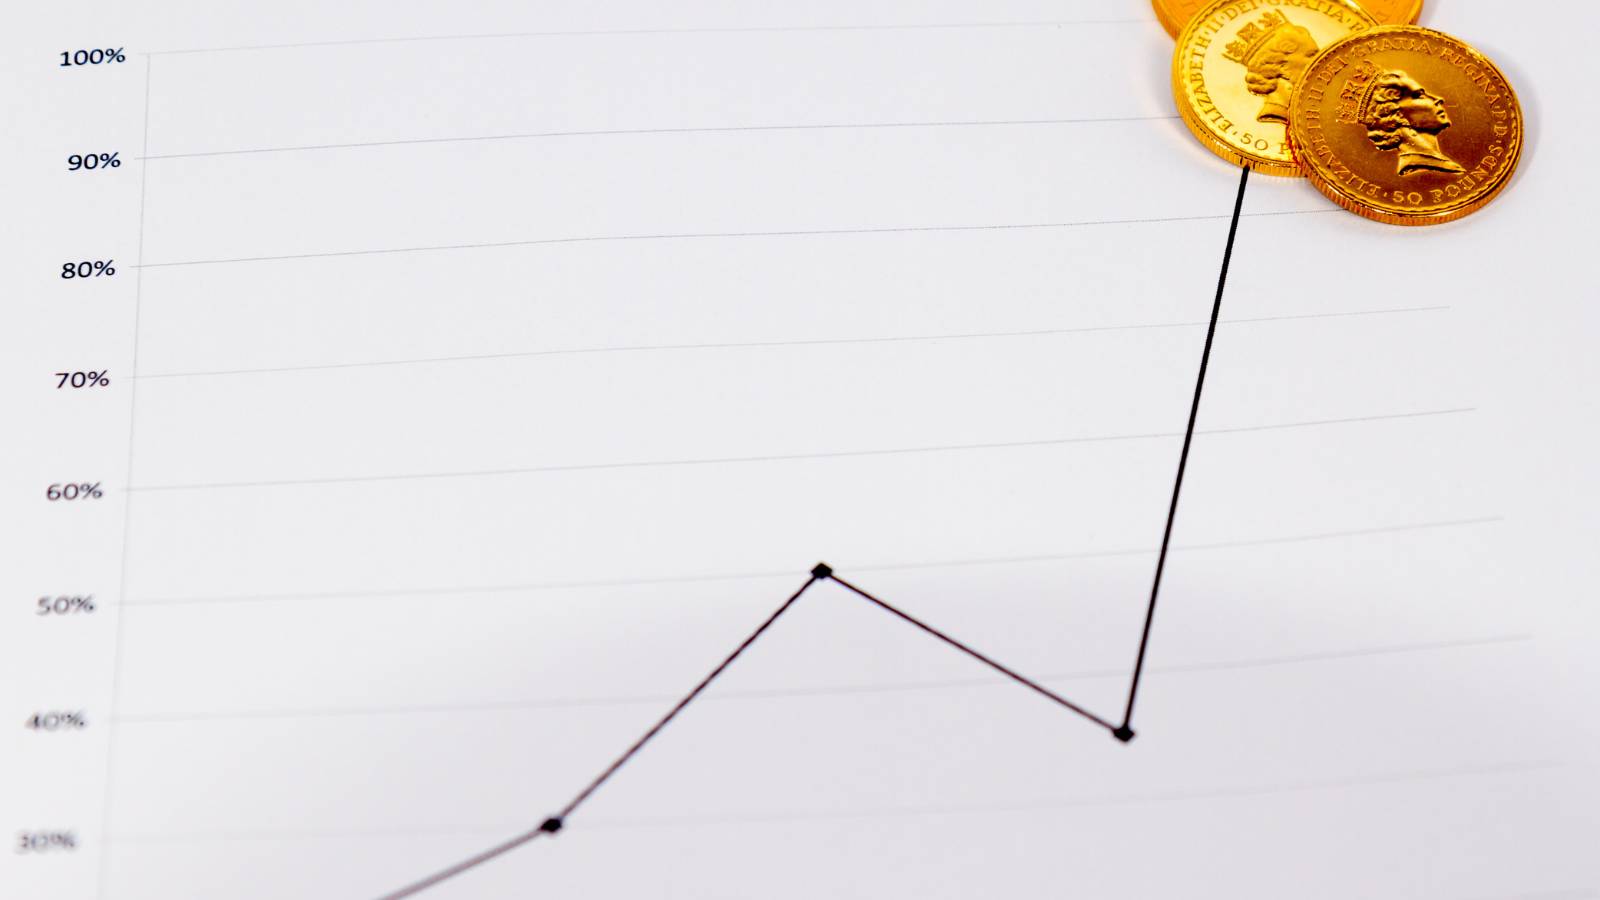
If you look up the historical gold price chart yourself, note that longer-term charts are often shown on a logarithmic scale rather than a linear one. On a linear scale, an early, smaller-value increase looks tiny next to a later, larger one; on a logarithmic scale, identical percentage changes appear the same size, a more realistic picture of long-term returns. Also useful: the compound annual growth rate (CAGR), which turns a longer period's return into a single annual average, comparable across asset classes.
Frequently asked questions
Has the price of gold always risen over the long term? Not evenly: there have been multi-decade stagnant or declining periods, yet the overall trend has still been more upward than downward over the past half century. This is not a guarantee for the future.
What caused the largest historical swings? Typically inflation shocks, financial crises, and structural changes to the monetary system, such as the end of the fixed exchange rate in 1971.
Is it worth timing a purchase based on the historical chart? Past patterns provide context, but they are not suited to precise timing, which is why many buyers follow a gradual, regular purchasing strategy instead.
Why does this historical background matter? It sets more realistic expectations: it helps you accept significant short- to medium-term fluctuations, even if you view gold as a long-term, supplementary element of your savings.
Summary
Gold price history shows that the precious metal has, on several occasions, held its purchasing power reasonably well over the long term, particularly during crises, but the path there was far from a straight line. The alternation between multi-decade rising and stagnant periods teaches that gold can primarily be a long-term asset requiring patience, not a short-term speculative product. Past performance is no guarantee of the future, and how well this fits your savings strategy depends solely on your situation and goals; seek an independent professional opinion before deciding.
Book a free informational consultation
30 minutes, with no obligation. We give a transparent overview of the options, costs and risks of buying physical precious metals.